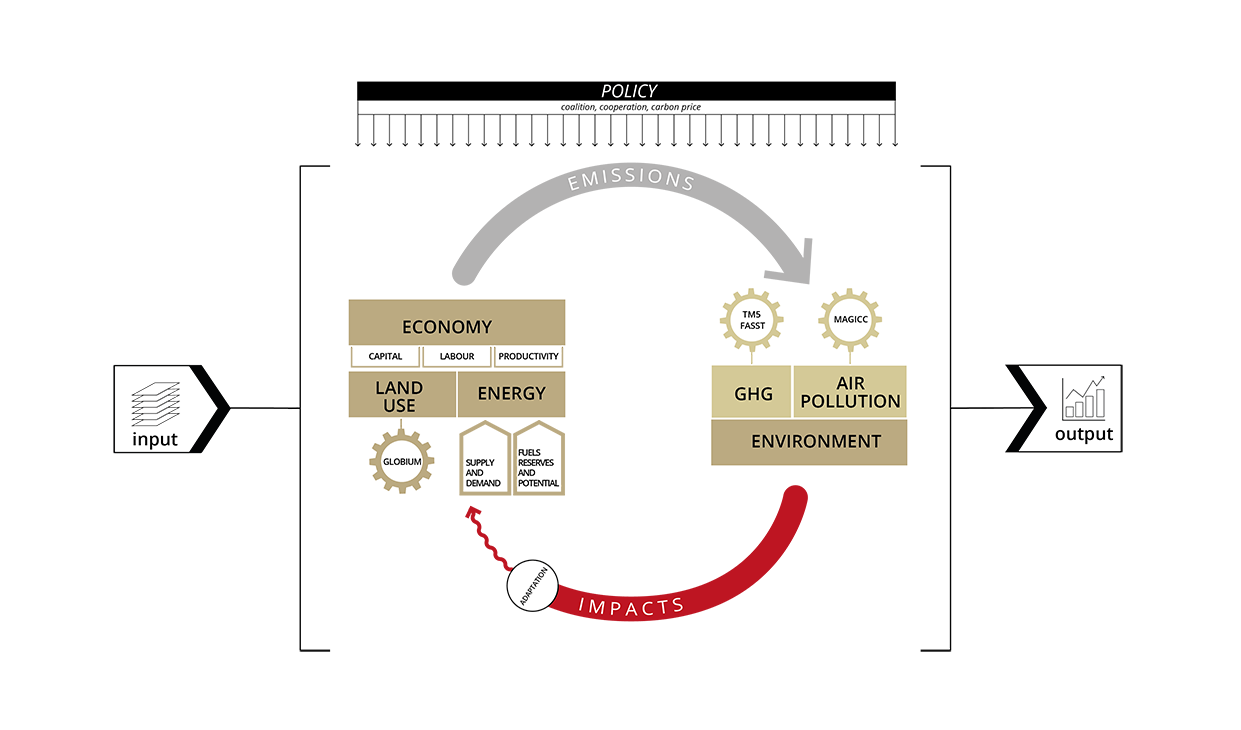
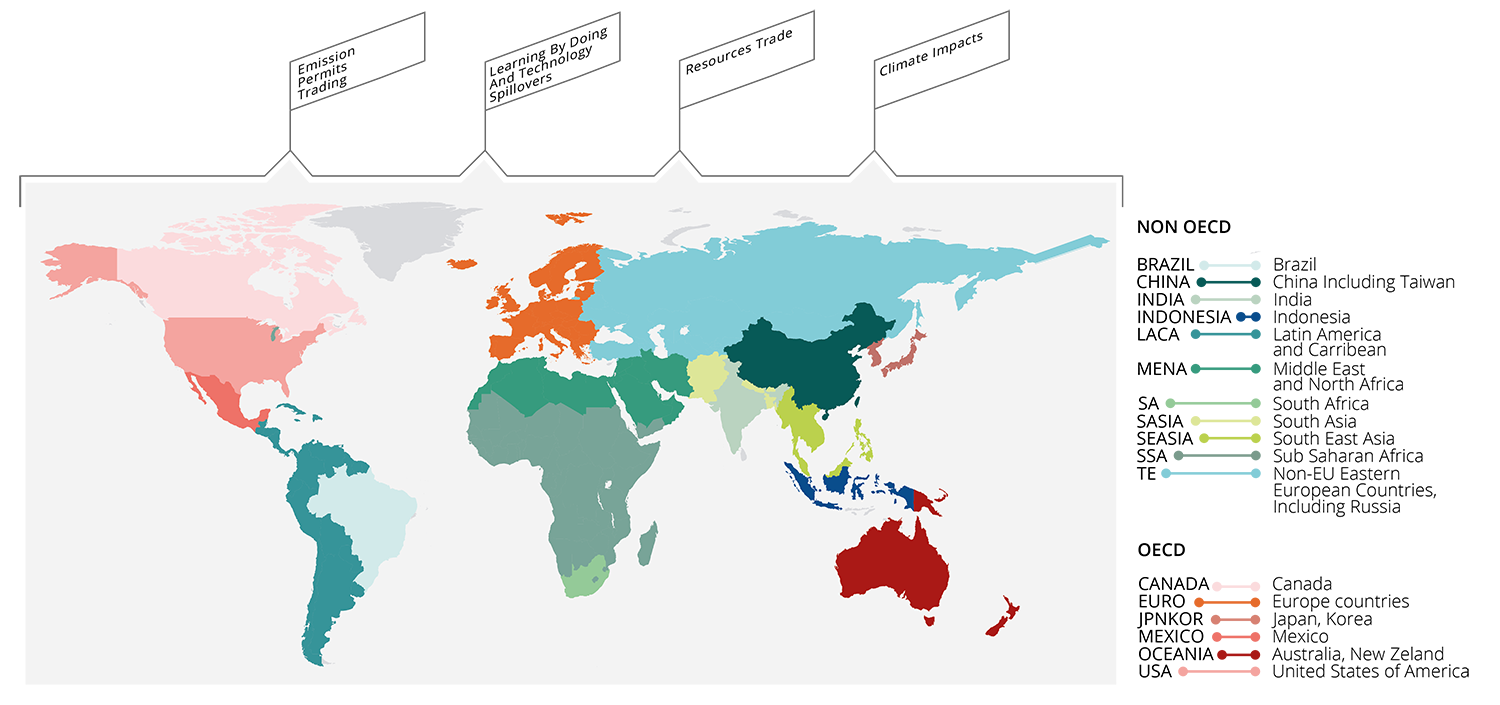
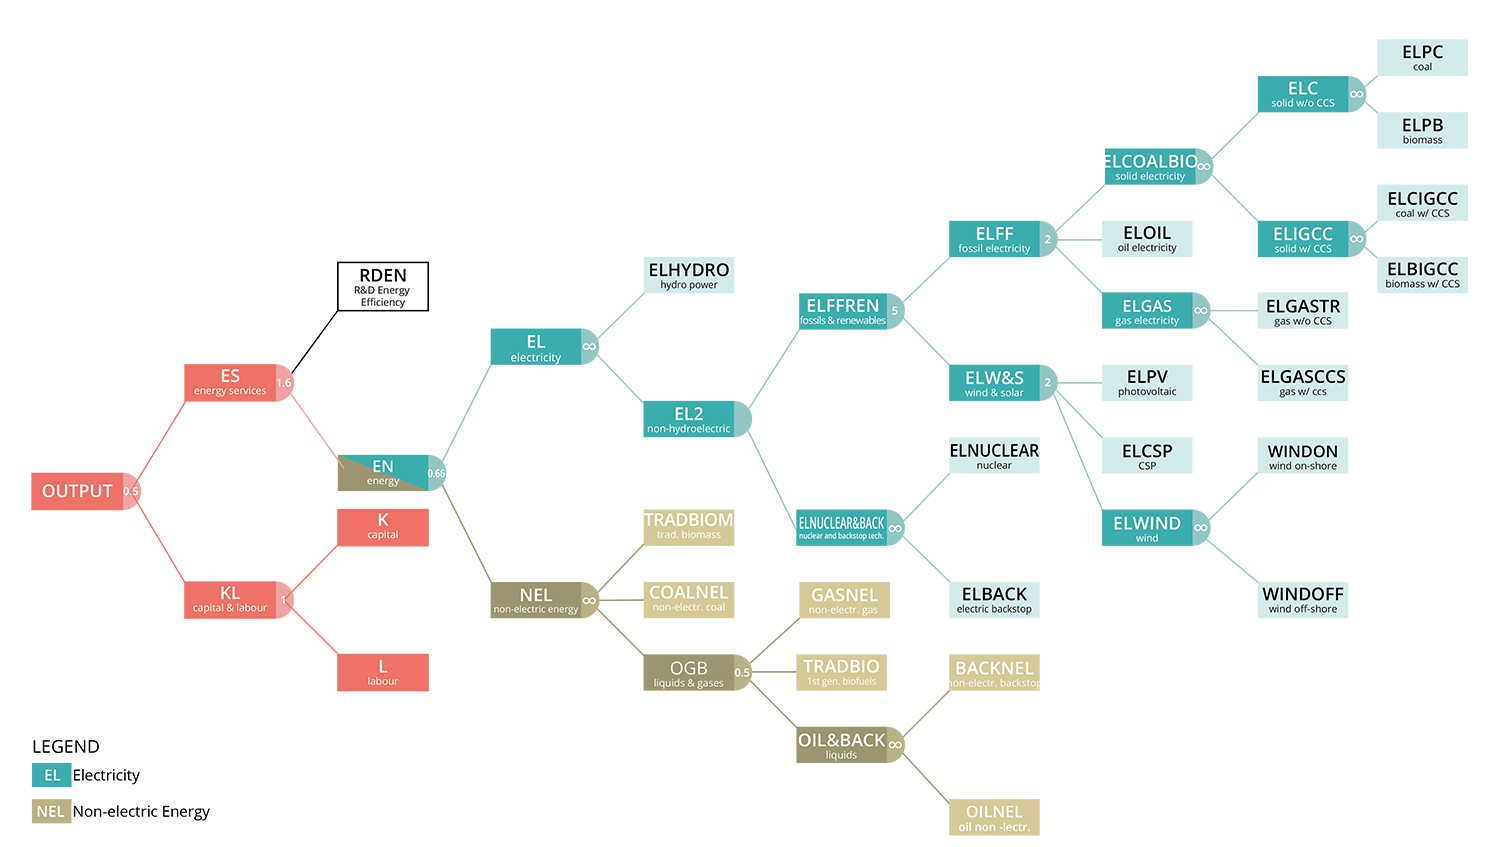
These few images were prepared for an internal presentation of the WITCH model. The first one had to summarise the functioning of this optimization model which relies on several modular parts influencing each other thanks to feedback loops and components modeling land use, greenhouse gas and pollution. They also needed a simple map who could show the regions interacting in WITCH and also a very technical production tree which summarises the internal functioning of the model.


